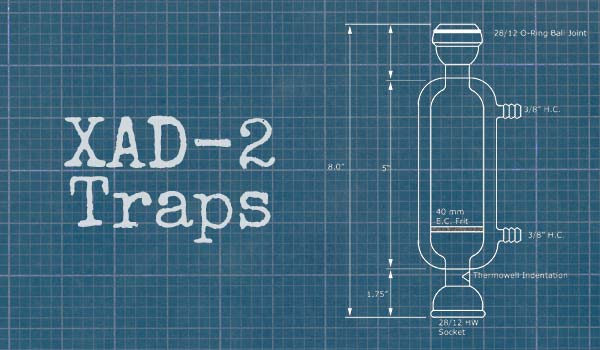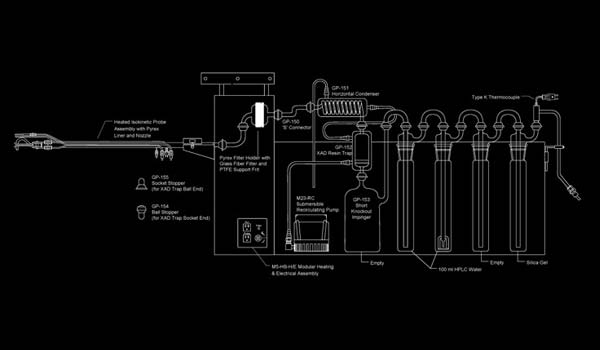
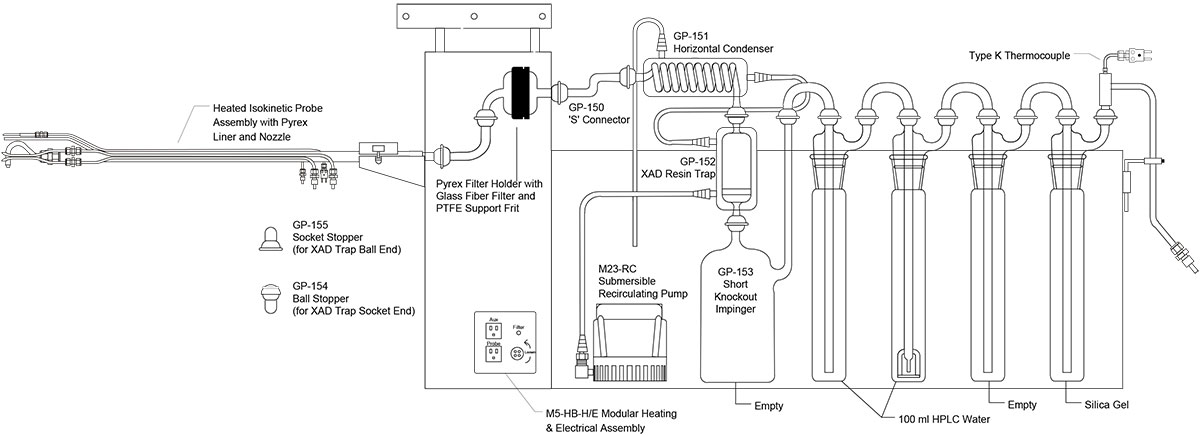
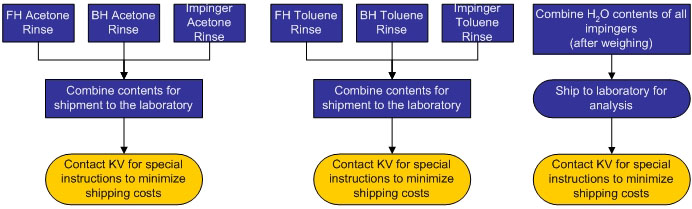
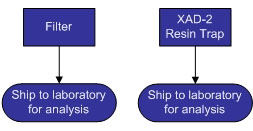
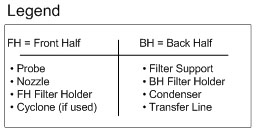
The schematic and flow charts pictured below detail the various components of a M23 train. M23 trains are used to collect dioxins and furans (D/F) from stack emissions and can also be used to collect polychlorinated biphenyls (PCBs) and polyaromatic hydrocarbons (PAHs). Various components of the train will need to be submitted to the laboratory for analysis. The components submitted are dependent upon the analytes (D/F, PCB, and/or PAH) required for analysis by the laboratory.
  |
 |
The results of D/F data are often expressed in terms of Total TEQ which provides an estimate of the toxicity of a sample. The Total TEQ value is used in risk assessment studies and regulations in the US and Europe set acceptable TEQ levels for D/F in air emissions. Using the TEQ approach, each individual 2,3,7,8-substituted D/F (there are 17) is assigned a Toxicity Equivalency Factor (TEF). The TEF factor correlates the toxicity of each 2,3,7,8-substituted D/F to 2,3,7,8-TCDD which is considered to be the most toxic of all D/F’s.
There are many sets of TEFs that can be used to calculate TEQ, however, the most commonly used set is the International Toxicity Equivalency Factors (I-TEF). These are the TEFs referenced in US EPA Method 23. The World Health Organization (WHO) TEFs also have wide use in risk assessment study data.
Compound |
I-TEF |
WHO (Mammals/Humans) |
|---|---|---|
| 2,3,7,8-TCDD | 1 | 1 |
| 1,2,3,7,8-PeCDD | 0.5 | 1 |
| 1,2,3,4,7,8-HxCDD | 0.1 | 0.1 |
| 1,2,3,6,7,8-HxCDD | 0.1 | 0.1 |
| 1,2,3,7,8,9-HxCDD | 0.1 | 0.1 |
| 1,2,3,4,6,7,8-HpCDD | 0.01 | 0.01 |
| OCDD | 0.001 | 0.001 |
| 2,3,7,8-TCDF | 0.1 | 0.1 |
| 1,2,3,7,8-PeCDF | 0.05 | 0.05 |
| 2,3,4,7,8-PeCDF | 0.5 | 0.5 |
| 1,2,3,4,7,8-HxCDF | 0.1 | 0.1 |
| 1,2,3,6,7,8-HxCDF | 0.1 | 0.1 |
| 2,3,4,6,7,8-HxCDF | 0.1 | 0.1 |
| 1,2,3,7,8,9-HxCDF | 0.1 | 0.1 |
| 1,2,3,4,6,7,8-HpCDF | 0.01 | 0.01 |
| 1,2,3,4,7,8,9-HpCDF | 0.01 | 0.01 |
| OCDF | 0.001 | 0.001 |
To calculate a sample’s TEQ, you multiply the concentration of each specific analyte by its corresponding TEF which gives you the TEQ for each 2,3,7,8-substituted D/F. Sum the TEQ for each 2,3,7,8-substituted analyte to get the Total TEQ for the sample.
TEQsample = Sum (concentration x TEF)2,3,7,8-substituted analyte
The Benefits of HRMS vs. LRMS
Most regulations pertaining to stack air emissions require the use of high
resolution mass spectrometry (HRMS). The only D/F data accepted by the US
EPA for stack air emissions test must be analyzed using HRMS. In some countries,
stack emissions are not as strictly regulated as in the US and Europe and
some companies will use LRMS (low resolution mass spectrometry) for the
D/F analyses because it costs less than HRMS analyses. Substituting an equivalent
lower cost alternative for a piece of equipment or analysis is a way to
increase project profits. However, the key word in the previous sentence
is: equivalent. You need to ensure that you are making the switch of an
equivalent substitute so you get the results that you need. A poorer quality,
lower cost alternative can end up costing you significantly more in the
long run.
HRMS and LRMS methods are not equivalent. While LRMS is a useful technique in many applications (e.g., as a screening tool), it is not a recommended technique for stack emission data for D/Fs, PCBs, and PAHs.
The benefits of HRMS are:
1. A higher level
of Quality Assurance/Quality Control (QA/QC).
The HRMS methods use more 13C-labeled PCDDs and PCDFs to monitor extraction
and clean-up efficiencies and provide more accurate analyte quantitation.
HRMS |
LRMS |
|
|---|---|---|
| Internal Standard | 9 | 5 |
| Clean-up/Surrogate Standard | 5 | 1 |
| Recovery Standard | 2 | 2 |
2. Accurate results
for PCDDs and particularly for PCDFs.
The labeled standards and target D/F analytes have similar masses. Two
masses are monitored by for each analyte and standard, typically either
the M/M+2 or M+2/M+4 masses. If present at high enough levels, a M+2
or M+4 mass of one analyte can “breakthrough” and contribute
to another mass that can artificially elevate the analyte level.
The LRMS method was designed for samples that contain levels of D/F in the 1 ppb range. The 13C-standard spiking schemes are accordingly higher as well. This means that there is a chance for “breakthrough” from the standards into the analyte channels because the data is acquired at unit resolution. This problem is eliminated through use of HRMS because the data are acquired with a resolving power of at least 10,000. This ensures that breakthrough from standard masses to analyte masses does not occur. For example:
| Standard | Analyte |
Minimum Resolving Power Needed For Separation |
|---|---|---|
| 13C-TCDF | TCDD | 8000 |
| 13C-PeCDF | PeCDD | 9000 |
| 13C-HxCDF | HxCDD | 10000 |
| 13C-HpCDF | HpCDD | 11000 |
| 13C-OCDF | OCDD | 12000 |
3. “No false
positives” from commonly encountered interferences.
Both the HRMS and LRMS subject the sample to extensive clean-up procedures
to remove interferences. While the clean-up removes a significant percentage
of the interferences that might be present in the sample, it doesn’t
remove them all. The specificity of the HRMS detector is so precise
that it virtually removes the possibility that you will have false positives.
This is an important designation because many chlorinated compounds
(PCB in particular) can have the same mass as D/F if you round to the
nearest whole amu (atomic mass unit).
A HRMS detector responds to a mass within a 100-ppm wide window. This means the detector can distinguish m/z 320 +/- 0.032. Compare this to the range of a LRMS detector which responds to any mass within a 1 window, e.g. 320 +/- 0.5.
4. “No false
negatives” from commonly encountered interferences.
See the discussion in point 3 above.
5. Monitors GCMS
performance every second of the analysis.
The HRMS method requires that an ion (sometimes referred to as the PFK
ion or system performance check ion) be monitored throughout the entire
analysis to provide a measure of the basic sensitivity and stability
changes of the instrument. Interferences, if present, are typically
called quantitative interferences (QI) because they may impact the quantitation
of the analyte. This technique allows you to determine if the quality
of the reported result is impacted, make an estimate of the QI, and
make decisions if additional sample clean-up and reanalysis is needed.
The LRMS method does not require a system performance check ion to be monitored because the check ion will interfere resulting in elevated detection limits. Therefore, you do not know if a quantitative interference is present that impacts your results and causes you to over- or underestimate the analyte concentration.
6. Lower detection
limits.
LRMS methods for D/F were designed for samples with analyte concentrations
in the 1 ppb and greater range. A comparison of the detection limits
for air emissions is shown below. Note the LRMS method was written for
the analysis of soil and water matrices, the target detection limits
below are converted to account for an air matrix.
HRMS |
LRMS |
|
|---|---|---|
| TCDD/F | 2 pg | 10,000 pg |
| PeCDD/F | 5 pg | 25,000 pg |
| HxCDD/F | 5 pg | 25,000 pg |
| HpCDD/F | 5 pg | 25,000 pg |
| OCDD/F | 10 pg | 50,000 pg |
7. Better suited
for risk assessment.
Risk assessment studies, by nature, typically require the lowest possible
detection limits for the analytes that are involved in the study. For
this reason, HRMS is the most suitable option because of the lower detection
limits that can be achieved.
Some things we can help you with